How to use text statistics and generate reports
They say that art cannot be estimated objectively. But some numbers can still reveal some truth about your projects. And they are in the Story Architect statistics module.
If you don't already have the Story Architect app or downloaded it a second ago, read the instructions on how to install it, as well as how to log in to your personal account.
There are two types of statistics in STARC:
- by project – shows what and how many elements are involved in a story and how they interact with each other;
- by session – shows how many words you’ve written today and which days were the most productive.
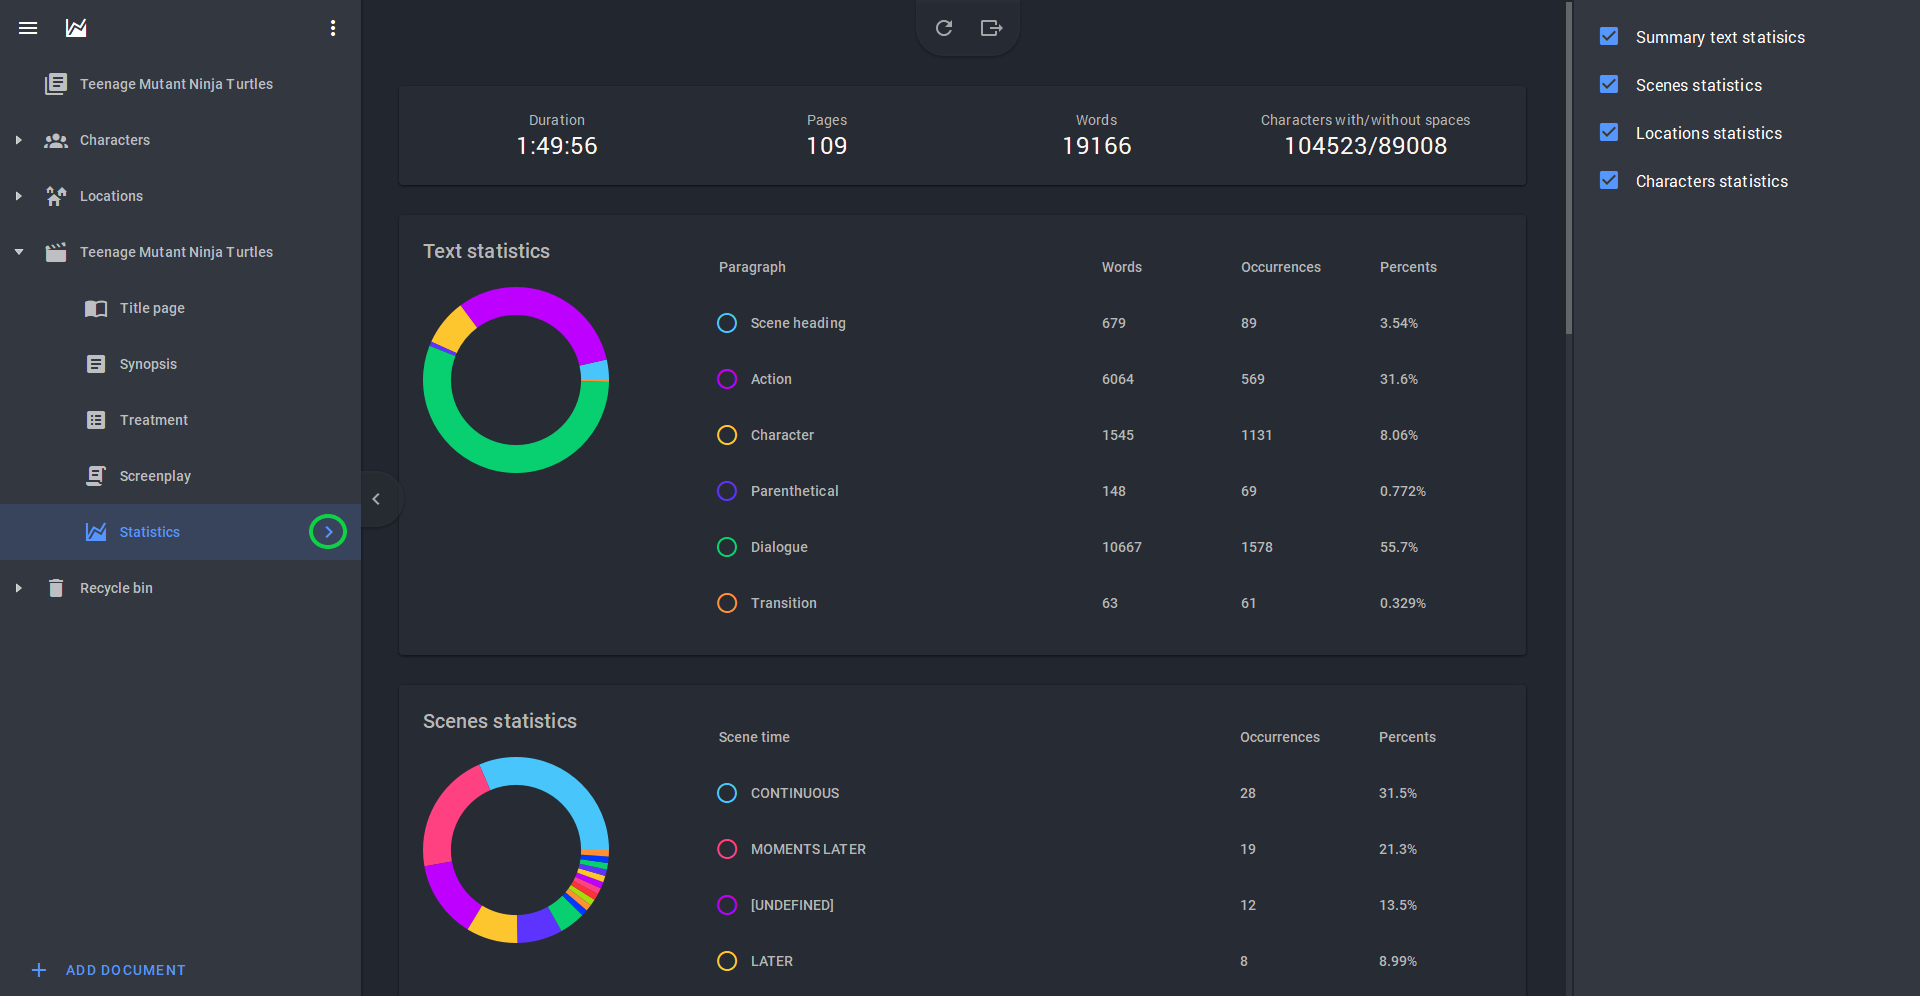
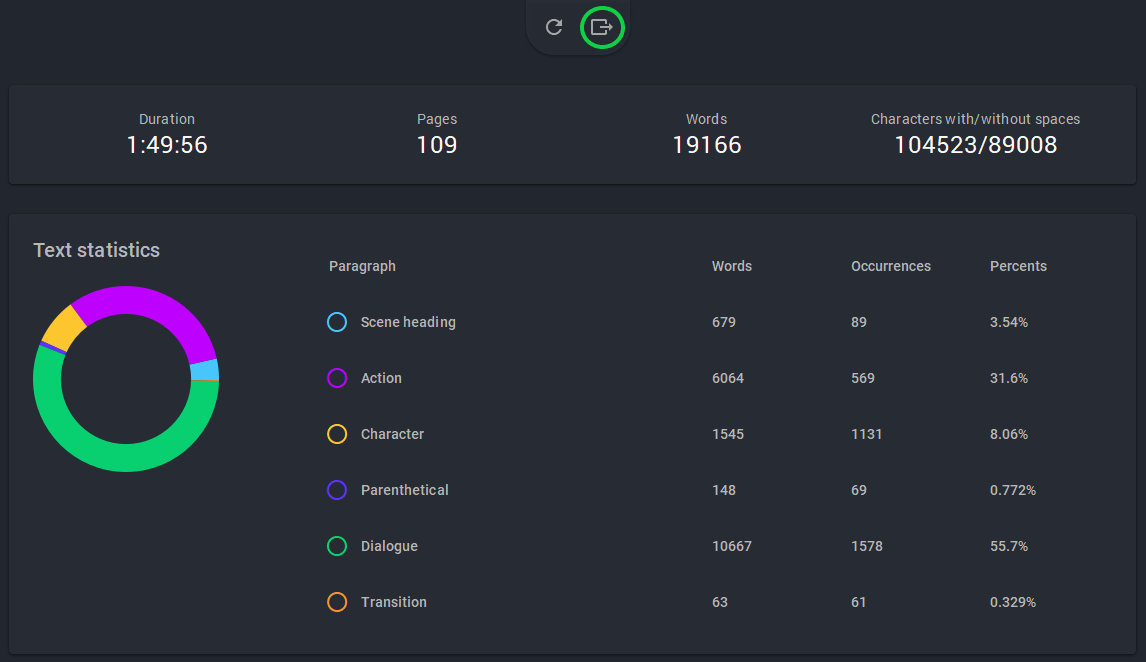
Let's start with the statistics by project and take a screenplay as an example. First, open the desired project and look for the "Statistics" item on the left panel. Click on the arrow next to this item – the summary statistics opens. Here you can find out the project timing and the number of pages, words and characters. The "Text statistics" section shows the ratio of descriptions, dialogues and other parts of the text. The "Scenes statistics" section shows in which setting most of the action takes place – day, night, or other times.
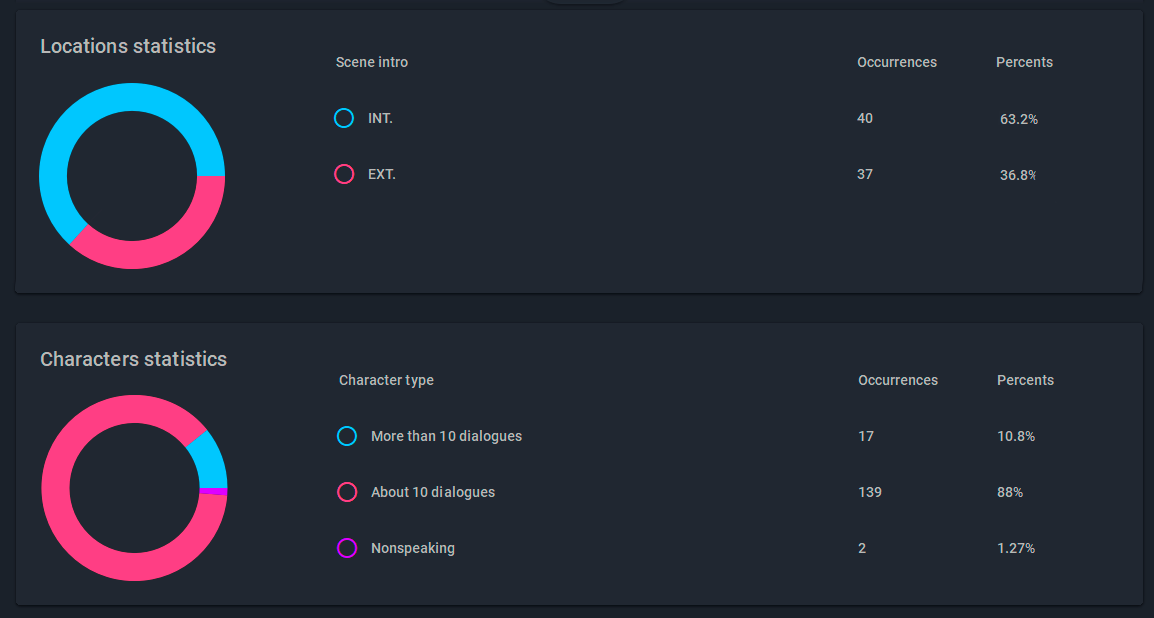
Below that is the "Locations statistics" section, where you can see the ratio of indoors and outdoors scenes. At the very bottom, the "Characters statistics" section shows how many characters say more and less than 10 lines in the entire screenplay.
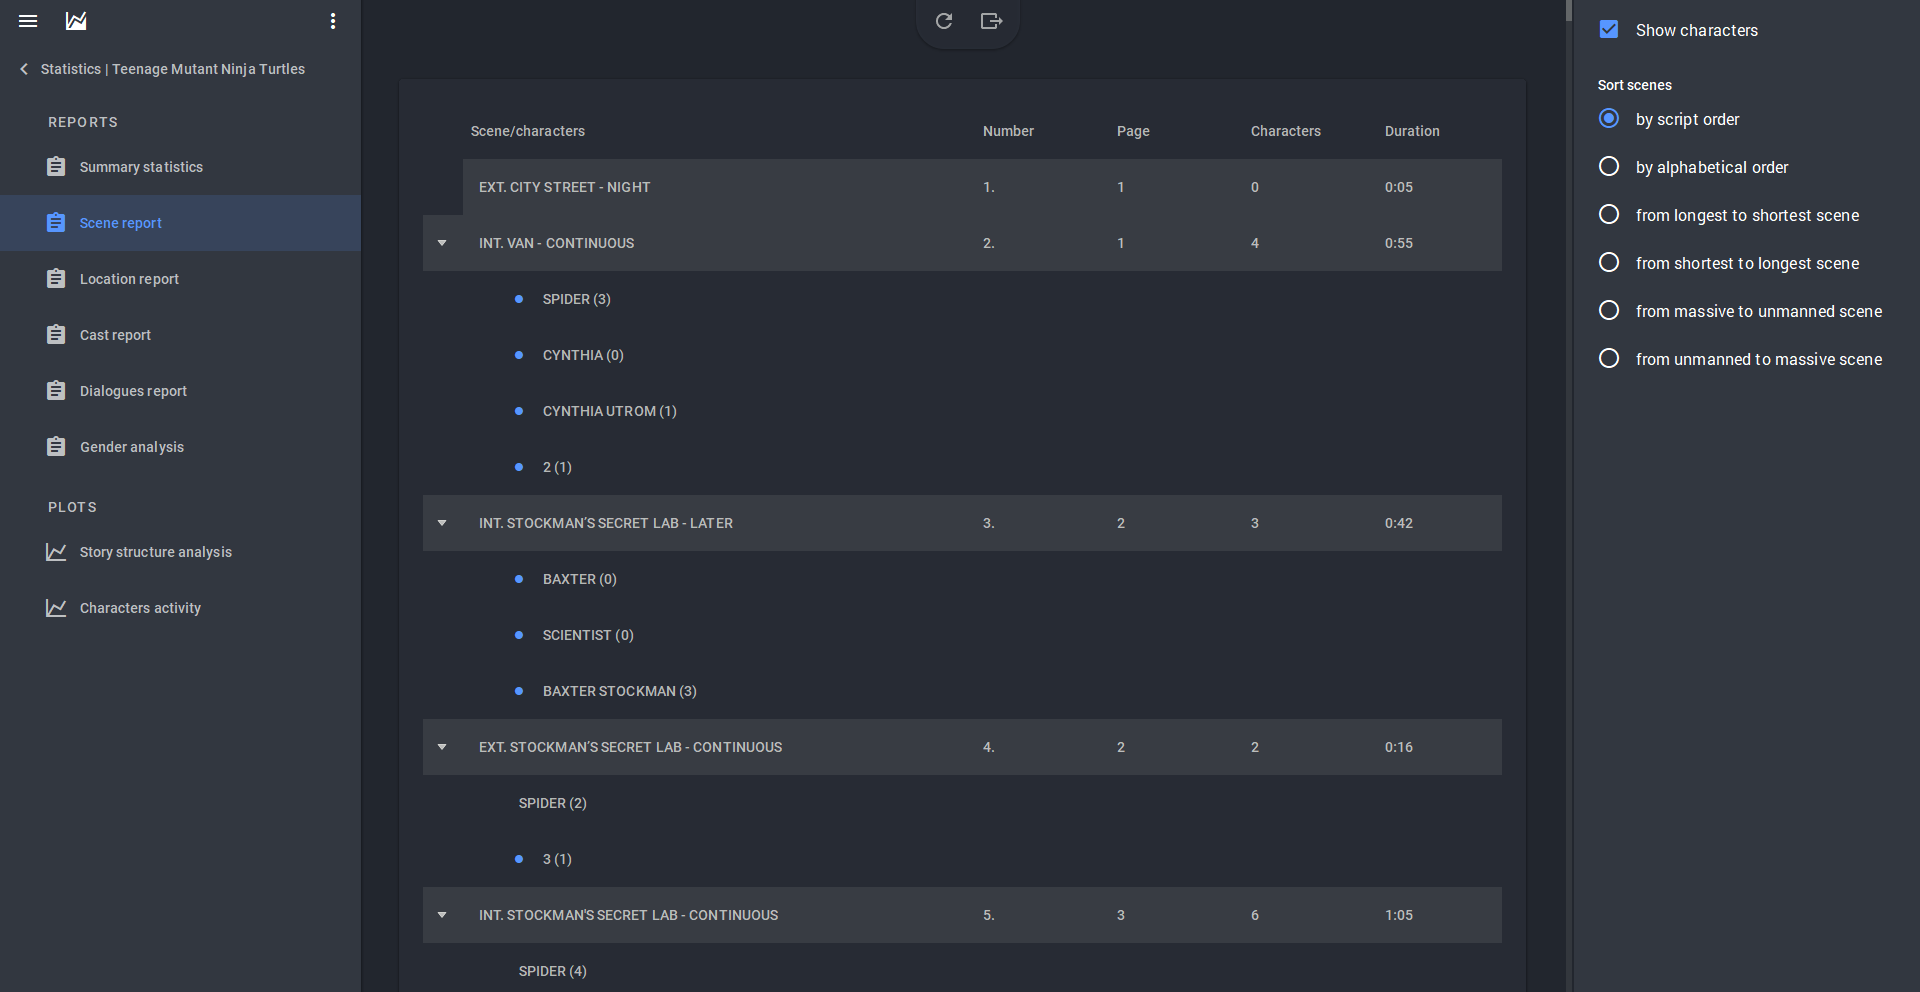
If you want to see more detailed statistics for each section, you should click on the corresponding item on the left panel. Please note that the list opens only when you click on the arrow near the "Statistics" item. If you just click on the name, only a summary of the main data will open. "Scene report" analyzes each scene in the project for characters and total duration. A blue circle next to a name means that this is the character's first appearance in the story. The entire list can be sorted by various criteria on the right panel.
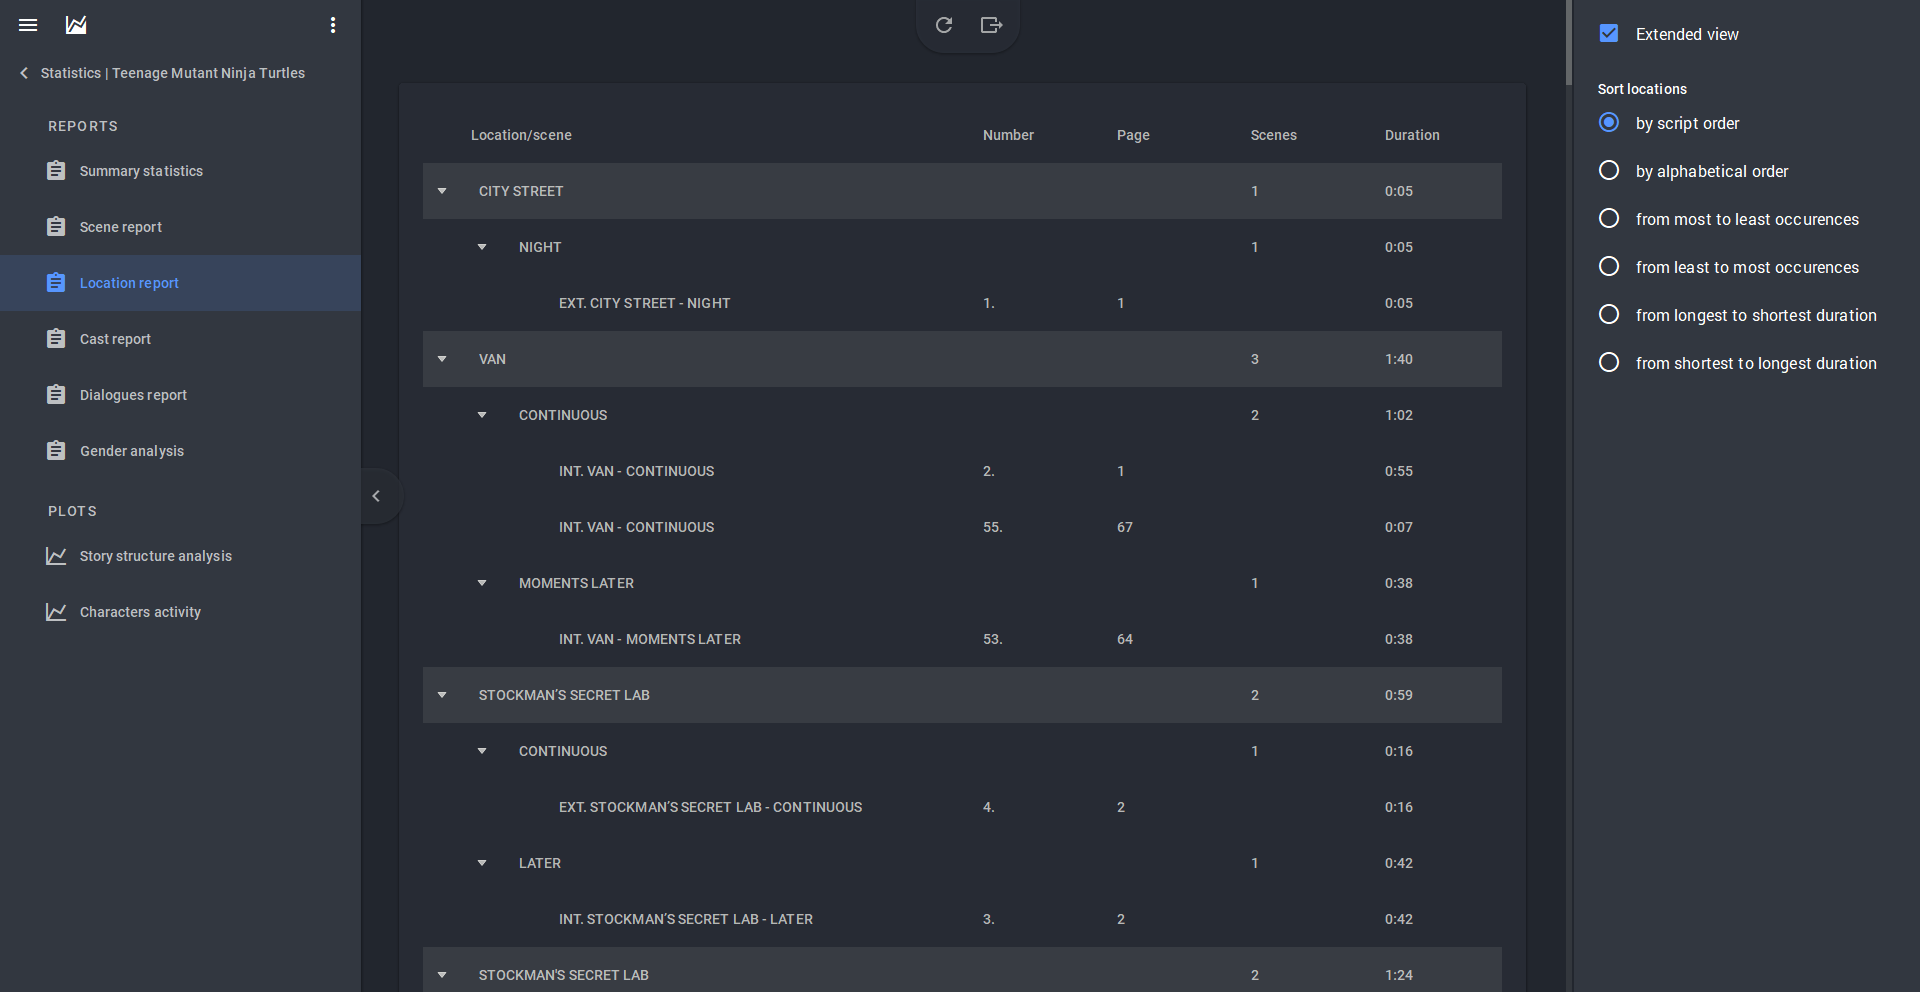
"Location report" is a useful tool for the producer. This section shows in which scene a particular location occurs, as well as how long it is involved.
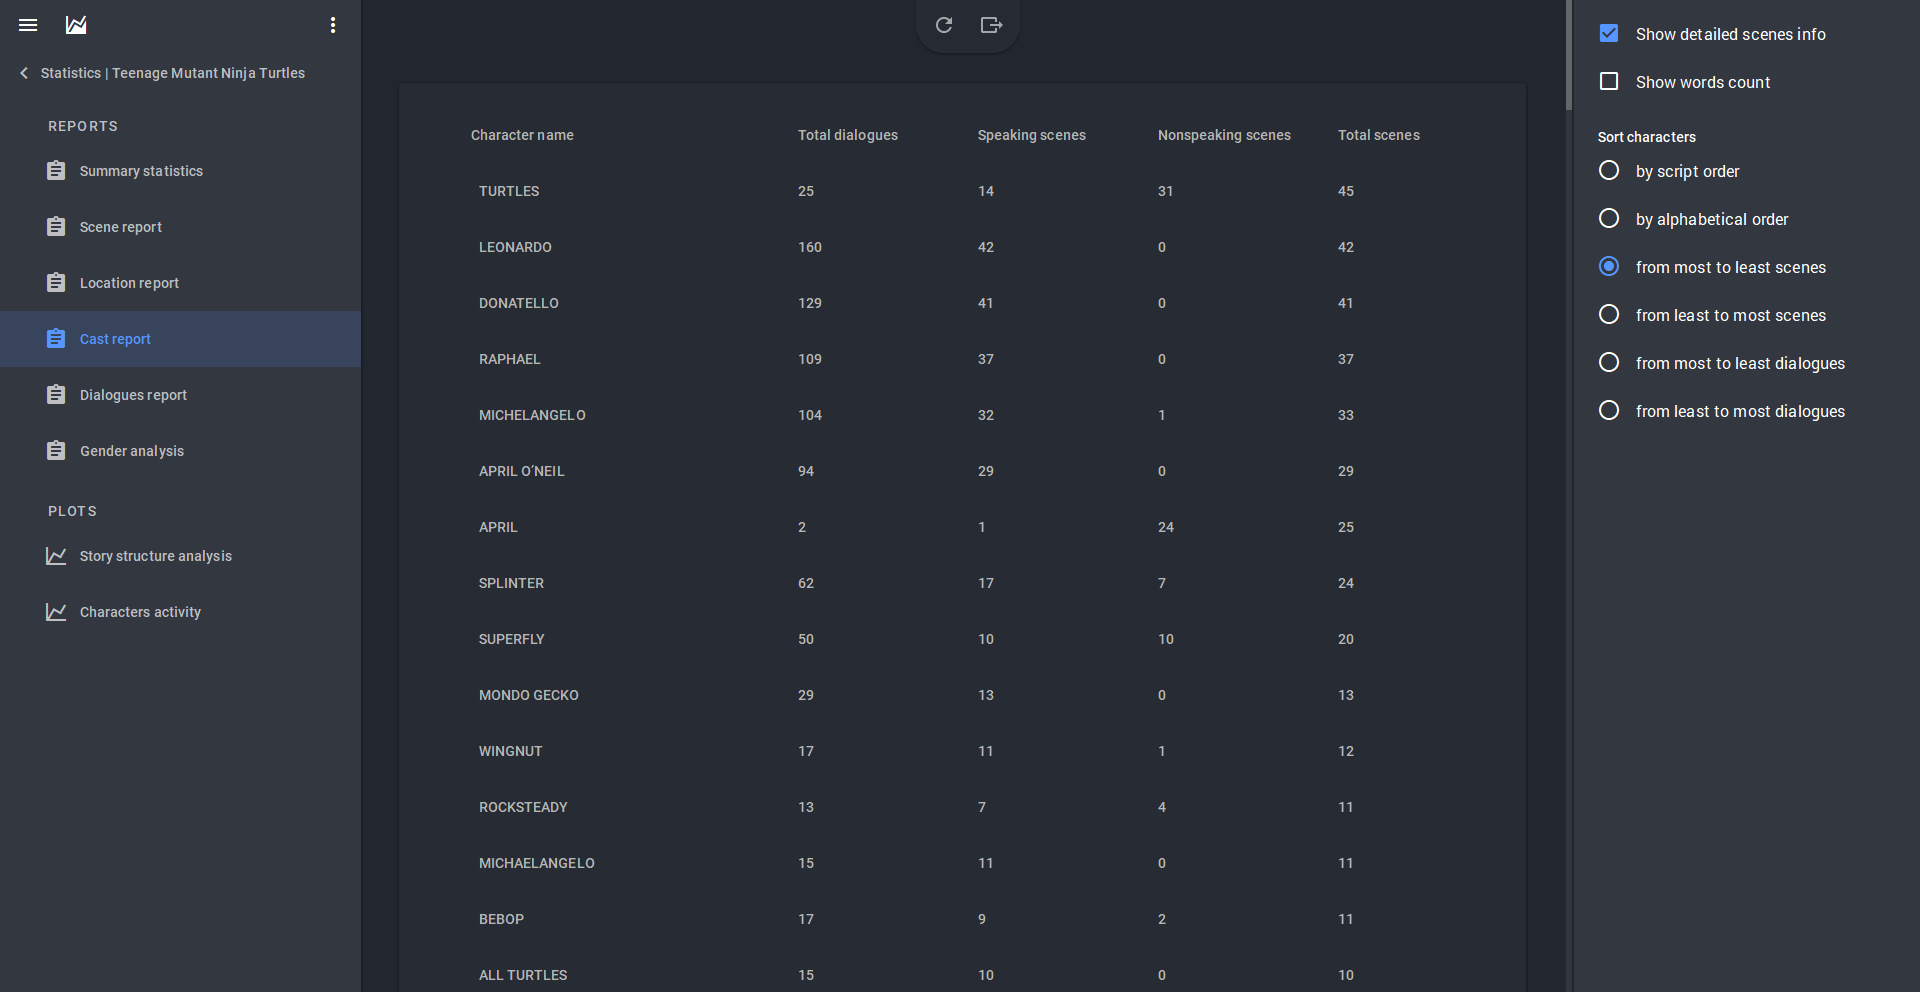
"Cast report" gives a complete summary of the characters, the number of their lines and the scenes where they appear. Can be useful for actors.
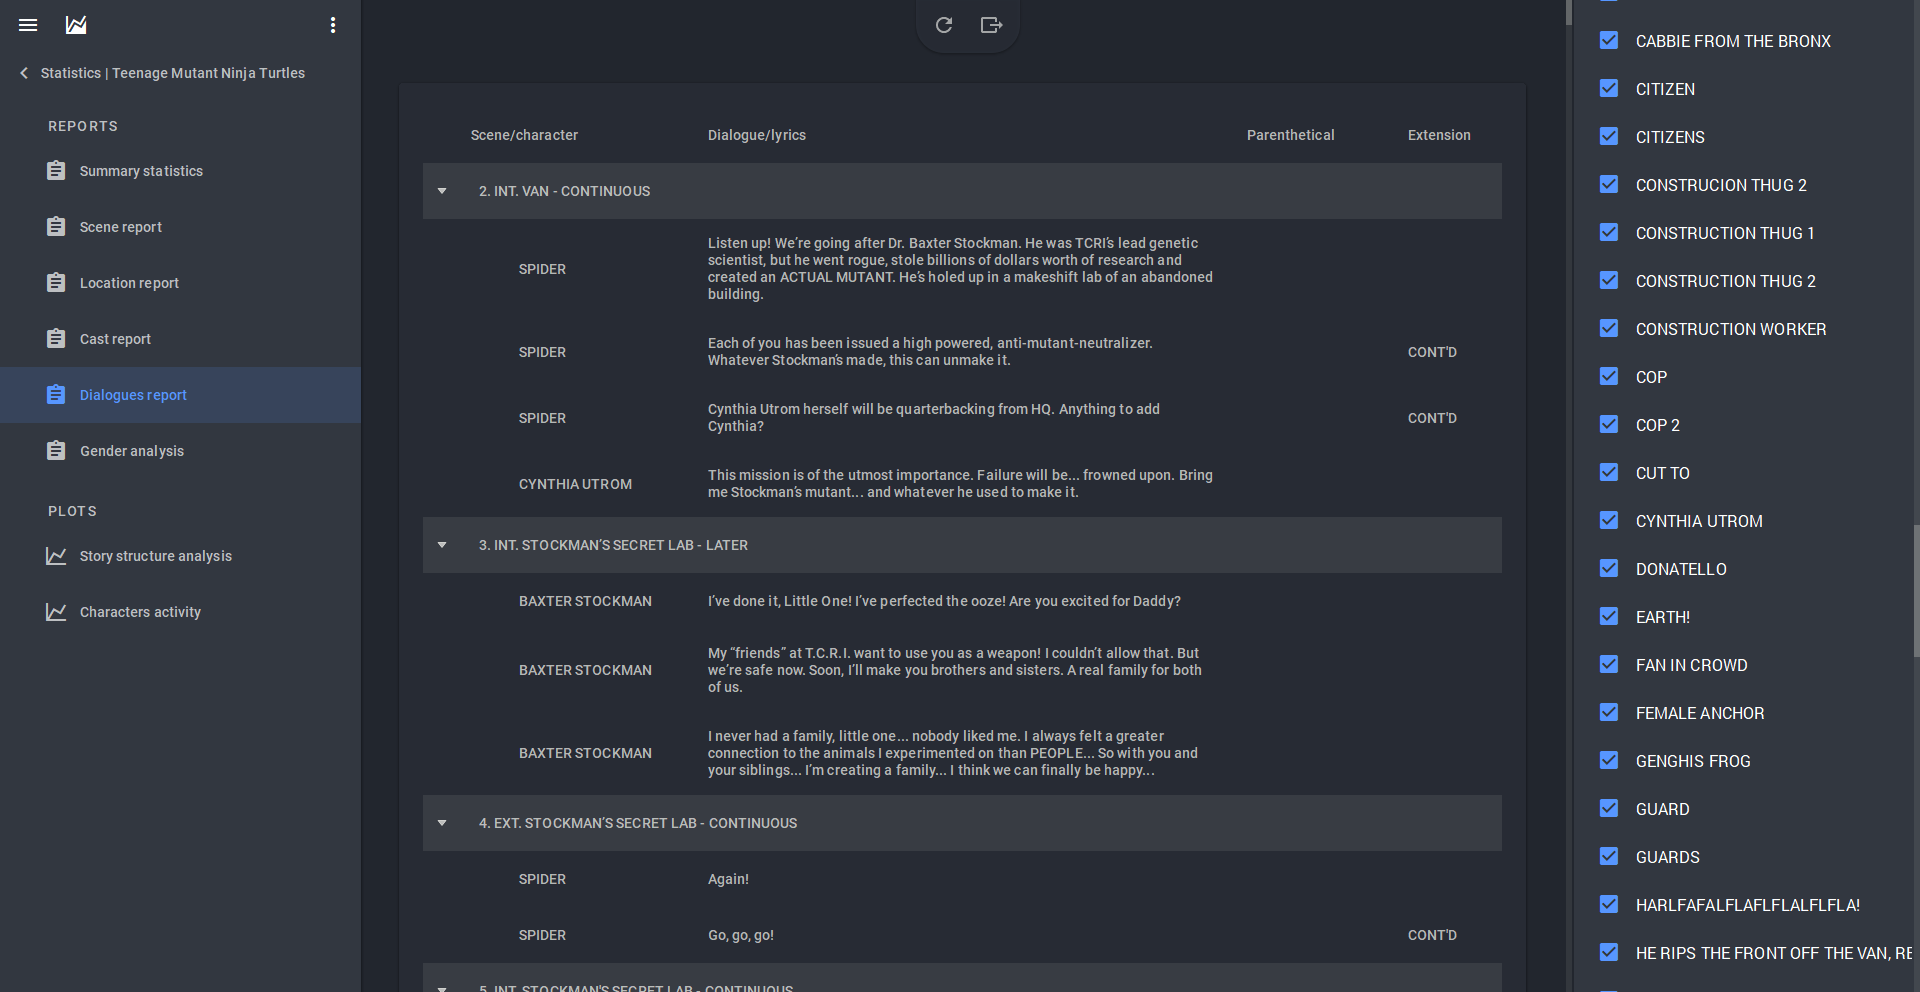
"Dialogues report" will show every line spoken by a character, as well as the parentheticals involved. On the right, you can select which characters' lines you would like to see.
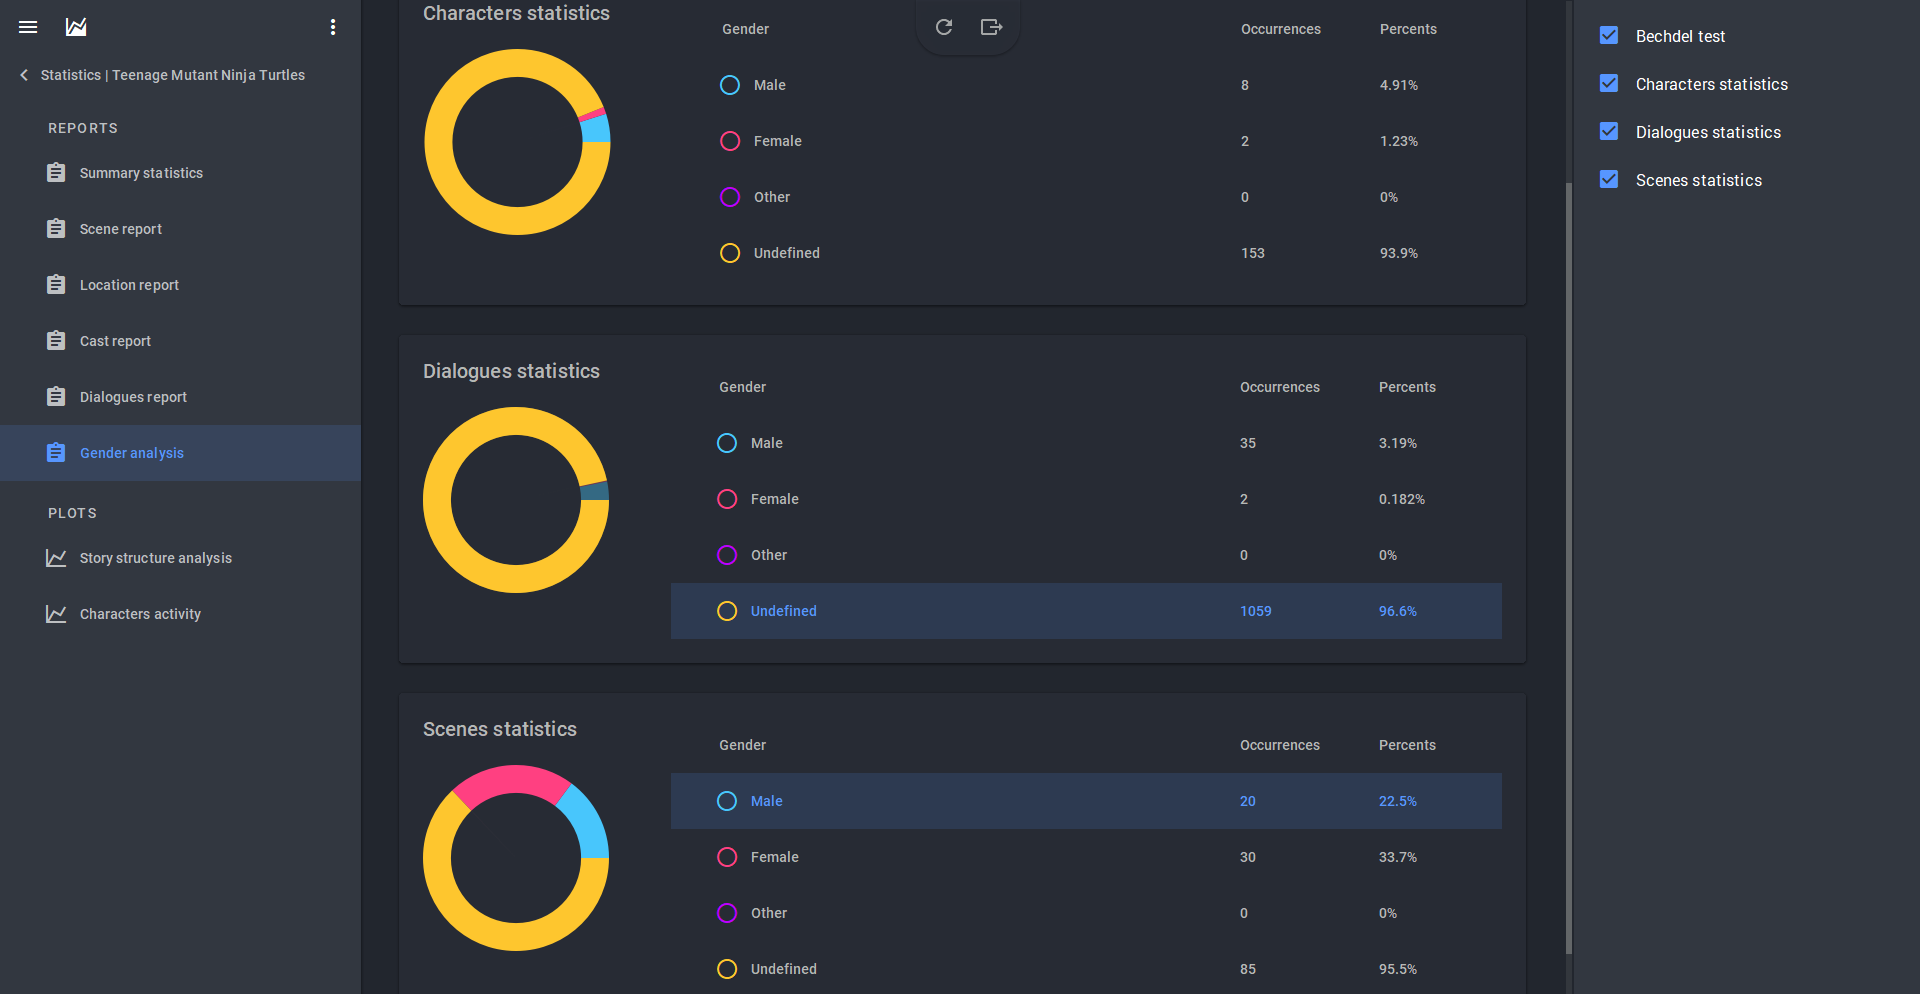
Finally, the “Gender analysis” section will show you how many female and male characters are involved in your story. Important: in order for the report to be generated correctly, you must specify the gender of the character in his/her profile. From above, you can also see if your work passes the Bechdel test: this is a quick check for gender bias in a work of fiction. To pass it, there must be at least two female characters in the story who have a conversation with each other about something other than men.
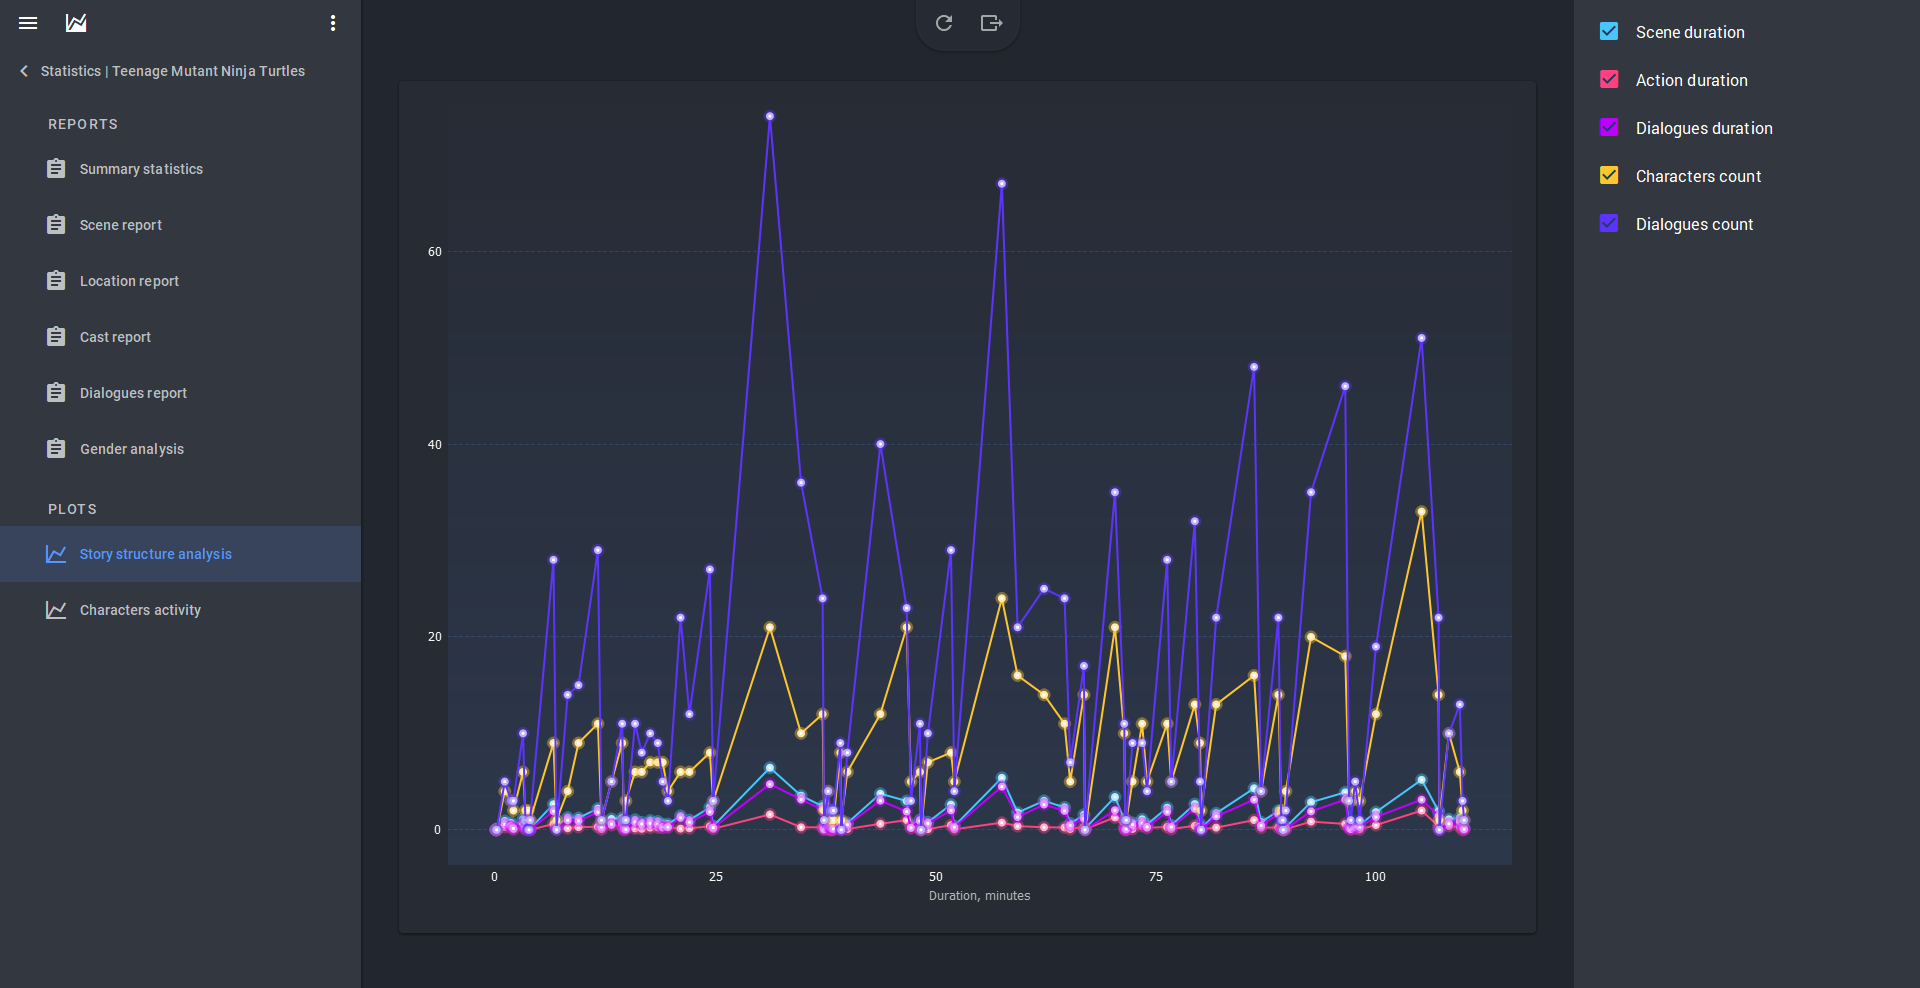
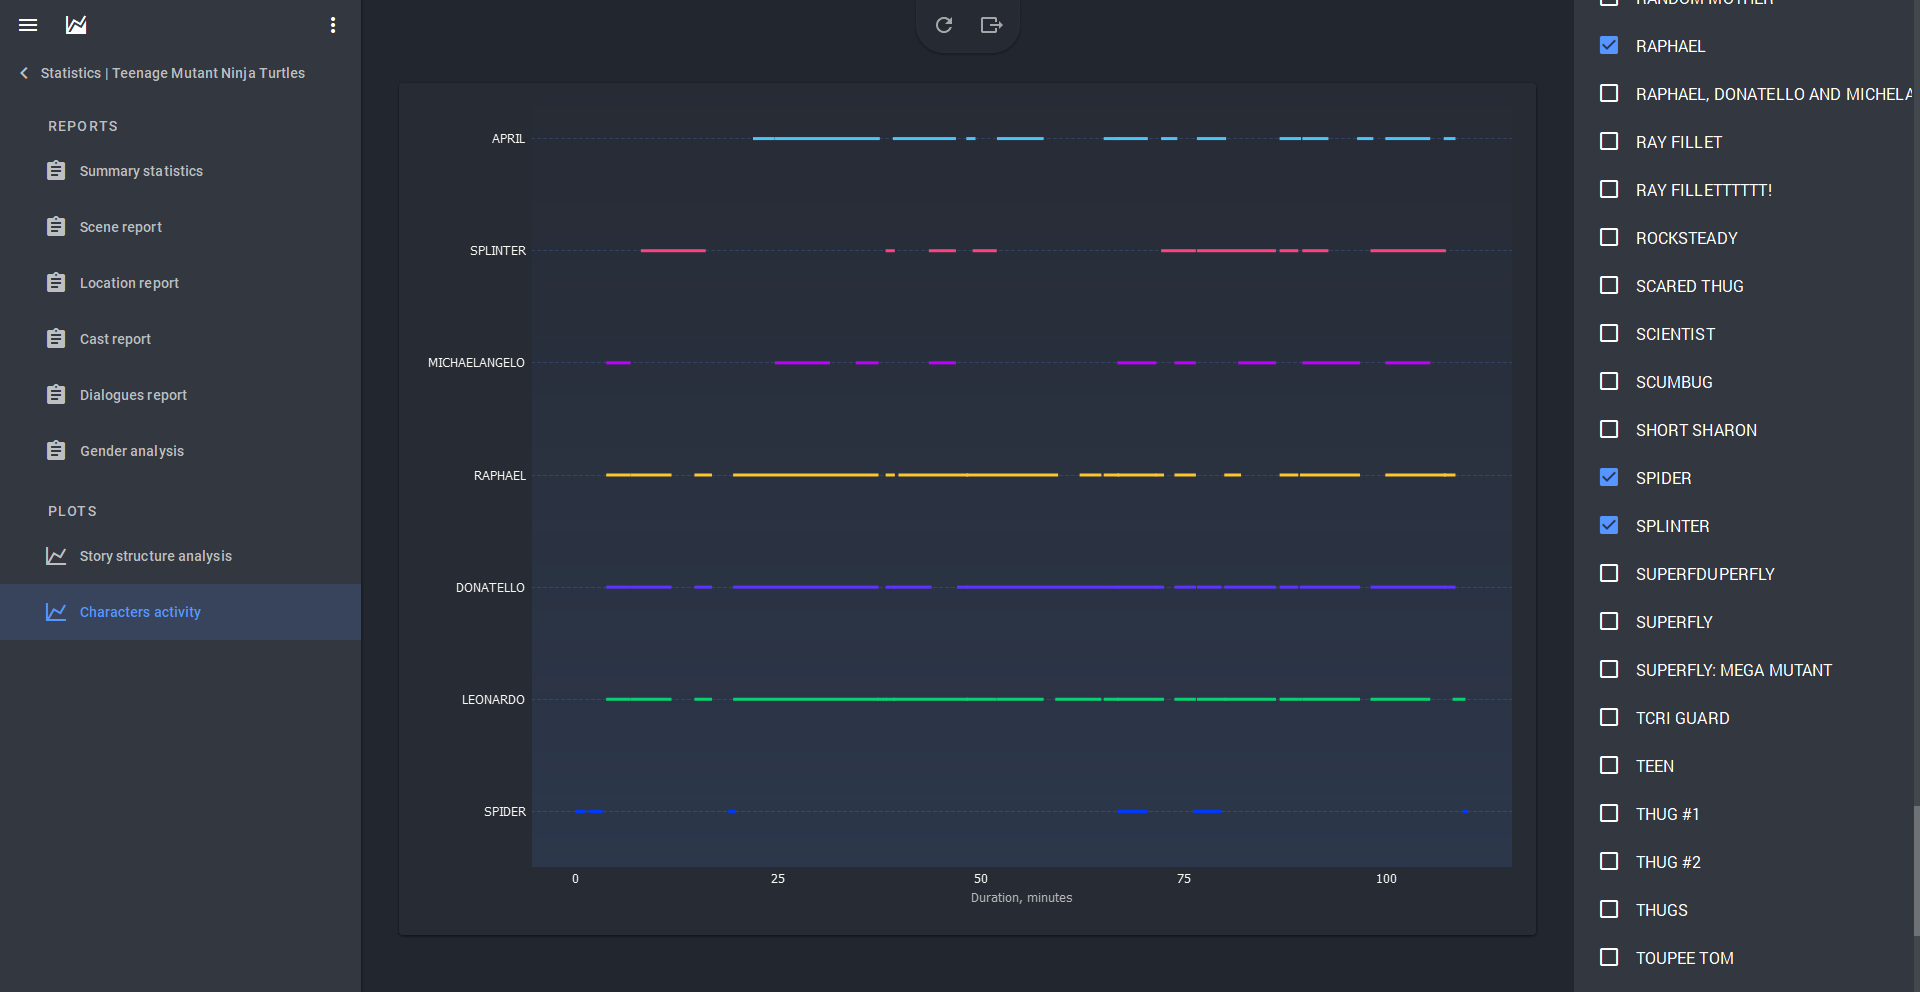
For plot structure geeks, there are two more sections, "Story structure analysis" and "Characters Activity." The first, in the form of graphs, shows the ratio of scenes / actions / lines duration to the number of characters and their lines.
The second section shows which characters appear at what moment in a scene - so you can track all their interactions throughout the story.
Any document from the statistics module can be exported in PDF or Excel format. Just click on the export icon at the top and specify the path to save the file.
Use the statistics module in STARC as an auxiliary tool to make your scripts brighter, more structured and accurate, and to make your work on them as comfortable as possible.
Join our community of authors
Download Story Architect and try all features for free. Give us your feedback — let's make the best software for writers together!